Geology is one of those things that is always happening around us, but sometimes it can be difficult to imagine the processes at work. That’s why we as geologists and geoscience educators rely heavily on the use of figures, diagrams, and maps (in addition to photos of features) to describe what is going on. Figures and diagrams work great for depicting really REALLY big scale processes and features all the way down to things taking place on an atomic level. I’ve spent a lot of time creating and editing geologic illustrations and figures, this page has a small sample.
If you are interested in higher-resolution versions or want to discuss creating other figures, please get in contact!
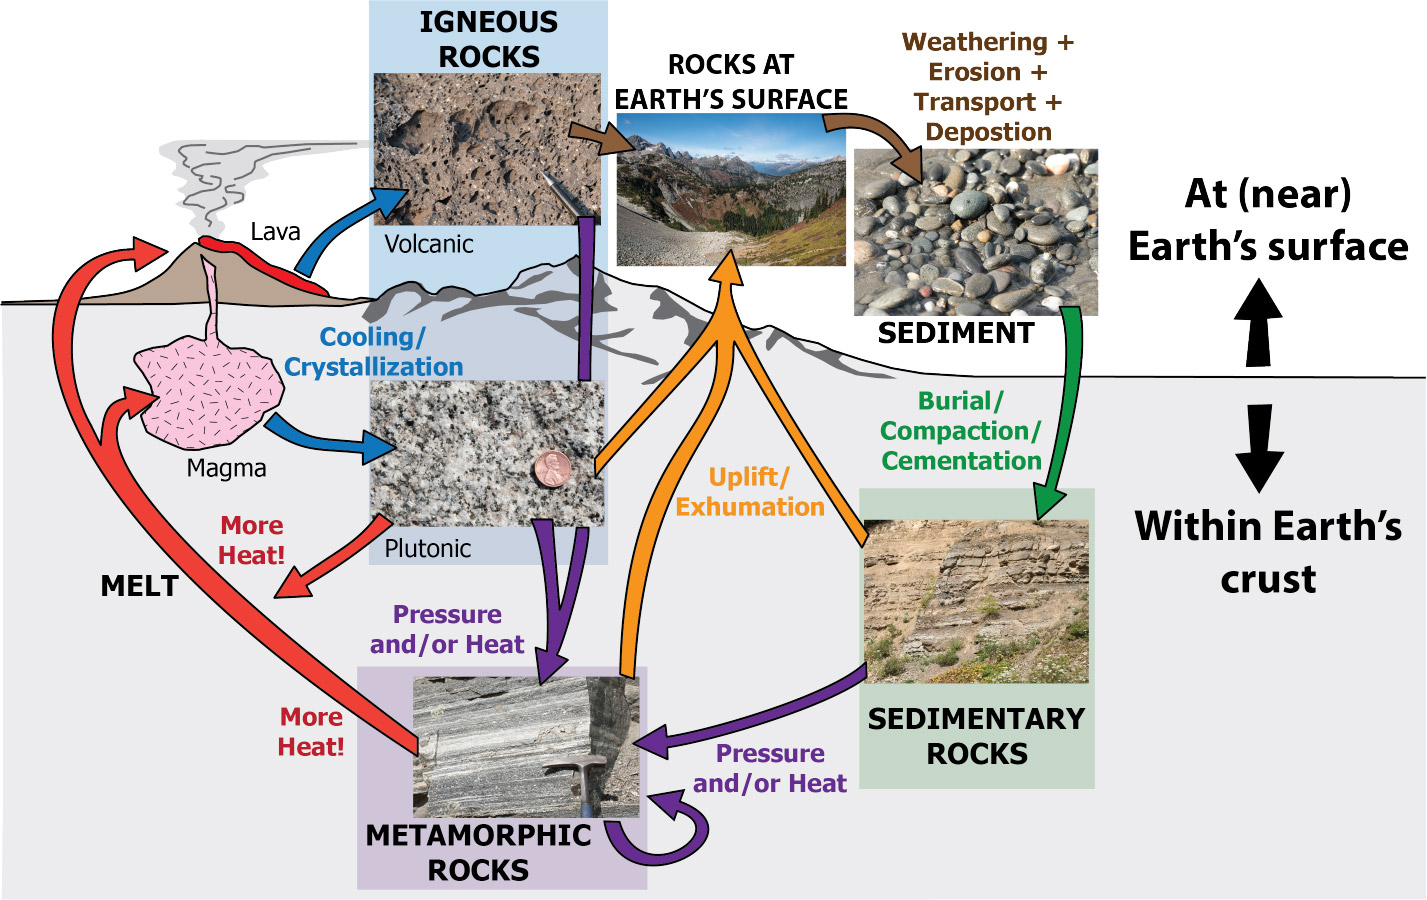
BIG-scale processes and features
Click on the thumbnail images below for a larger version.

Smaller-scale processes and features
Below: Block diagrams of different types of faults

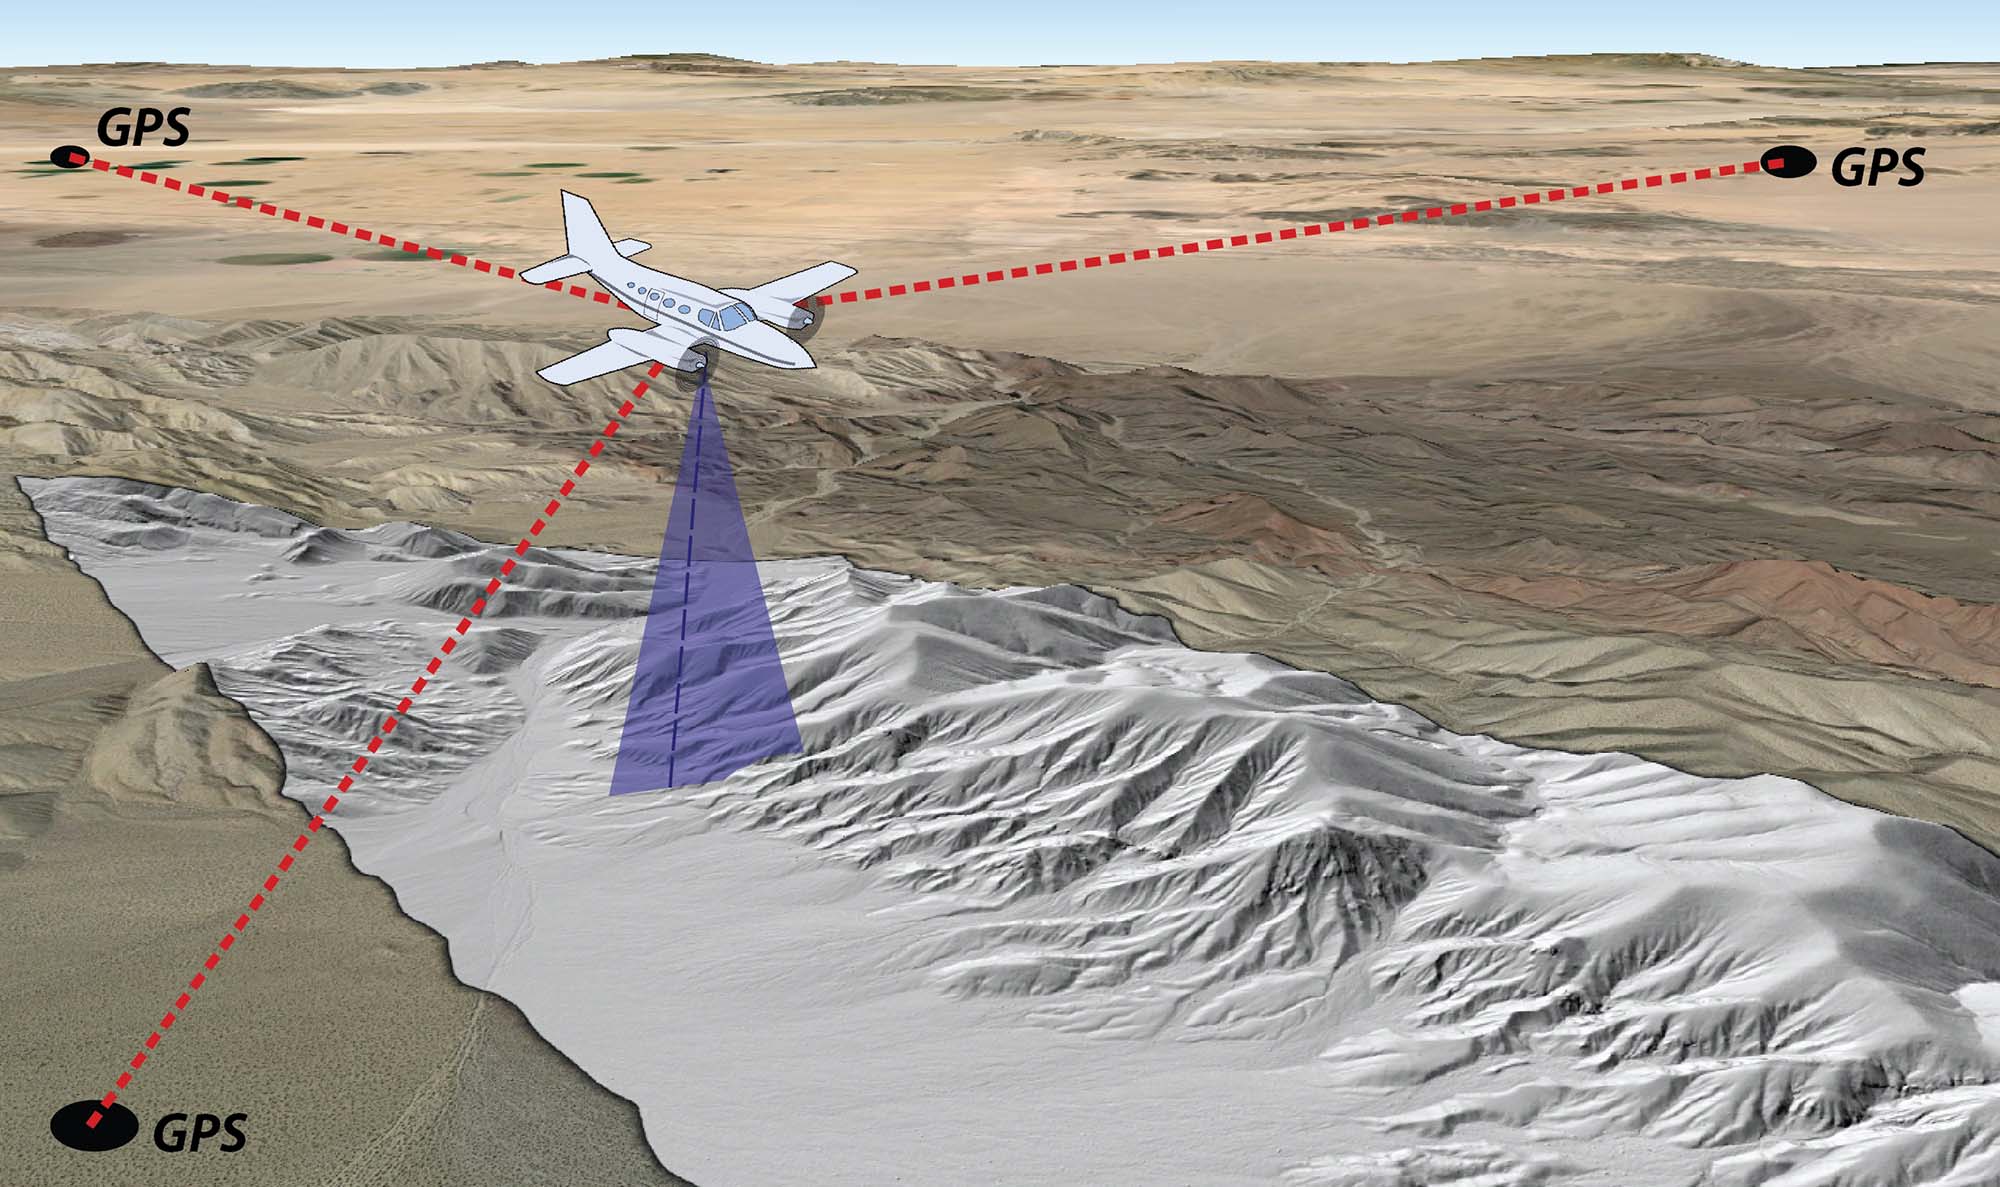
Below: Cartoon diagram showing how airborne lidar (LIght Detection And Ranging), a.k.a. ALSM (Airborne Laser Swath Mapping) data is collected. An airplane flies at a specified altitude, and shoots a laser at the ground underneath. An on-board computer records how long it takes the laser pulse to go from the plane, to the ground, and back- and does this at a rate of roughly 30,000 pulses per second! This can create an incredibly detailed digital topographic model of the Earth’s surface.
Maps and other diagrams
Geologic maps are a wonderful tool that we use to display the spatial distribution of different rock types, structures, hazards, etc. at the Earth’s surface. We can use data on these maps to make inferences about what the geology is doing at depth- which is just as important to understand as the geology at the surface!
I’ve been making and using geologic maps for almost 20 years, here are a couple examples:
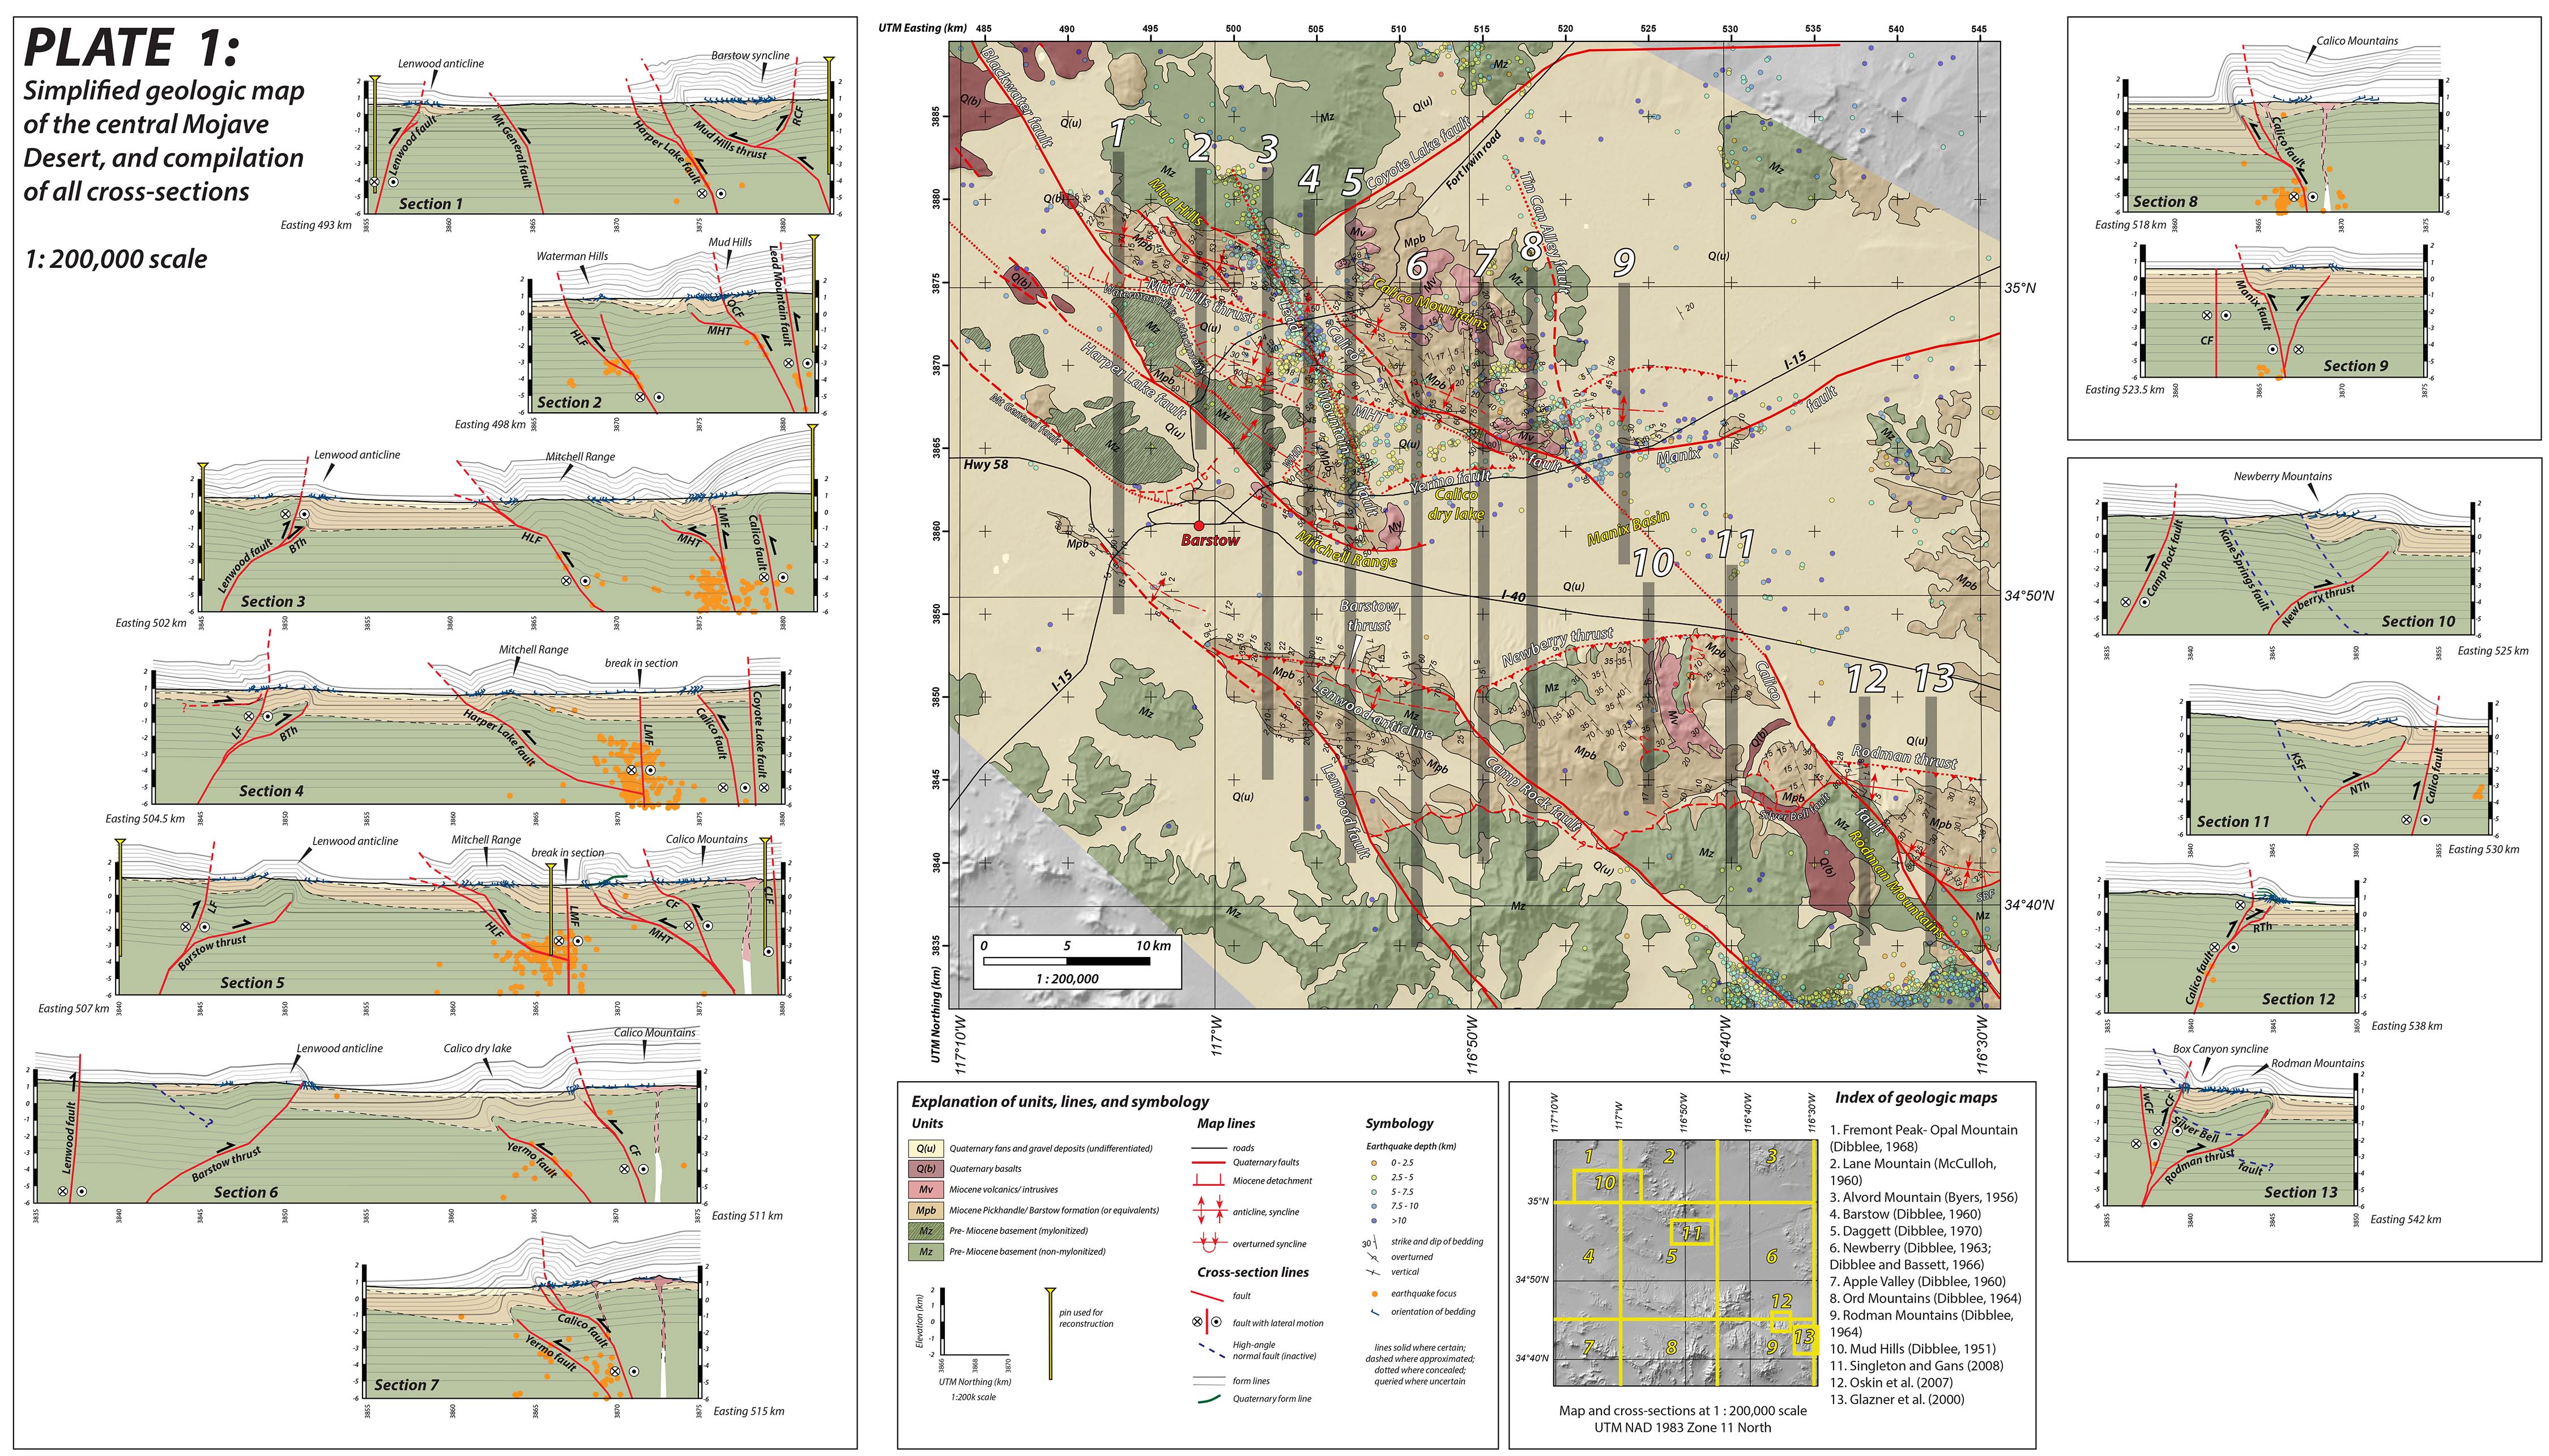
(1) Simplified geologic map of the central Mojave Desert, California; with balanced geologic cross-sections. From my 2015 Ph.D. dissertation (UC Davis)
(2) My poster presentation at the 2017 Geological Society of America Cordilleran Section Meeting- much of the work was done by myself and a group of students as part of a Neotectonics class I taught at the University of Minnesota- Duluth